

1. https://matplotlib.org/api/_as_gen/matplotlib.pyplot.html
matplotlib.pyplot — Matplotlib 3.0.3 documentation
matplotlib.pyplot matplotlib.pyplot is a state-based interface to matplotlib. It provides a MATLAB-like way of plotting. pyplot is mainly intended for interactive plots and simple cases of programmatic plot generation: import numpy as np import matplotlib.
matplotlib.org
matplotlib.pyplot
matplotlib.pyplot is a state-based interface to matplotlib. It provides a MATLAB-like way of plotting.
pyplot is mainly intended for interactive plots and simple cases of programmatic plot generation:
import numpy as np
import matplotlib.pyplot as plt
x = np.arange(0, 5, 0.1)
y = np.sin(x)
plt.plot(x, y)
The object-oriented API is recommended for more complex plots.
2. 함수
3. 위 함수 실행
4. 위 함수 실행
5. https://www.tutorialspoint.com/python_pandas/python_pandas_series.htm
Python Pandas Series
Python Pandas - Series Advertisements Series is a one-dimensional labeled array capable of holding data of any type (integer, string, float, python objects, etc.). The axis labels are collectively called index. pandas.Series A pandas Series can be created
www.tutorialspoint.com
https://pandas.pydata.org/pandas-docs/stable/reference/api/pandas.Series.map.html
pandas.Series.map — pandas 0.24.2 documentation
Parameters: arg : function, dict, or Series Mapping correspondence. na_action : {None, ‘ignore’}, default None If ‘ignore’, propagate NaN values, without passing them to the mapping correspondence.
pandas.pydata.org
https://docs.scipy.org/doc/numpy/reference/generated/numpy.random.randn.html
numpy.random.randn — NumPy v1.16 Manual
Parameters: d0, d1, …, dn : int, optional The dimensions of the returned array, should be all positive. If no argument is given a single Python float is returned.
docs.scipy.org
8. https://pandas.pydata.org/pandas-docs/stable/reference/api/pandas.DataFrame.corr.html
pandas.DataFrame.corr — pandas 0.24.2 documentation
Parameters: method : {‘pearson’, ‘kendall’, ‘spearman’} or callable pearson : standard correlation coefficient kendall : Kendall Tau correlation coefficient spearman : Spearman rank correlation callable: callable with input two 1d ndarrays and returning a
pandas.pydata.org

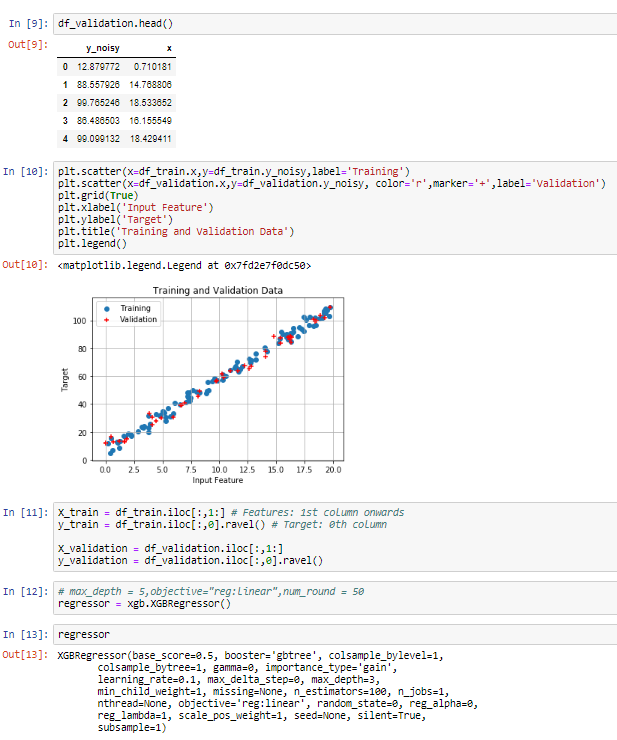
9. https://matplotlib.org/api/_as_gen/matplotlib.pyplot.scatter.html
matplotlib.pyplot.scatter — Matplotlib 3.0.3 documentation
Parameters: x, y : array_like, shape (n, ) The data positions. s : scalar or array_like, shape (n, ), optional The marker size in points**2. Default is rcParams['lines.markersize'] ** 2. c : color, sequence, or sequence of color, optional The marker color.
matplotlib.org
https://matplotlib.org/api/_as_gen/matplotlib.pyplot.grid.html?highlight=grid#matplotlib.pyplot.grid
matplotlib.pyplot.grid — Matplotlib 3.0.3 documentation
Parameters: b : bool or None Whether to show the grid lines. If any kwargs are supplied, it is assumed you want the grid on and b will be set to True. If b is None and there are no kwargs, this toggles the visibility of the lines. which : {'major', 'minor'
matplotlib.org
https://matplotlib.org/api/legend_api.html?highlight=legend#module-matplotlib.legend
legend and legend_handler — Matplotlib 3.0.3 documentation
Other Parameters: loc : int or string or pair of floats, default: rcParams["legend.loc"] ('best' for axes, 'upper right' for figures) The location of the legend. Possible codes are: Location String Location Code 'best' 0 'upper right' 1 'upper left' 2 'low
matplotlib.org
11. https://docs.scipy.org/doc/numpy/reference/generated/numpy.random.shuffle.html
numpy.random.shuffle — NumPy v1.16 Manual
Modify a sequence in-place by shuffling its contents. This function only shuffles the array along the first axis of a multi-dimensional array. The order of sub-arrays is changed but their contents remains the same. Parameters: x : array_like The array or l
docs.scipy.org
https://pandas.pydata.org/pandas-docs/stable/reference/api/pandas.DataFrame.iloc.html
pandas.DataFrame.iloc — pandas 0.24.2 documentation
Purely integer-location based indexing for selection by position. .iloc[] is primarily integer position based (from 0 to length-1 of the axis), but may also be used with a boolean array. Allowed inputs are: An integer, e.g. 5. A list or array of integers,
pandas.pydata.org
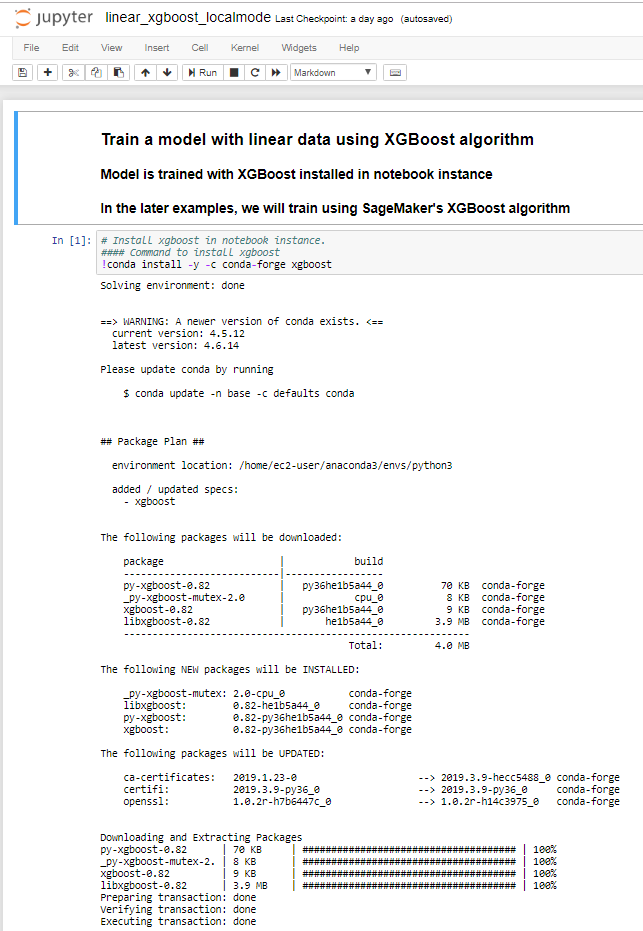
1. Install XGBOOST https://github.com/conda-forge/xgboost-feedstock
conda-forge/xgboost-feedstock
A conda-smithy repository for xgboost. Contribute to conda-forge/xgboost-feedstock development by creating an account on GitHub.
github.com
pandas.read_csv — pandas 0.24.2 documentation
Parameters: filepath_or_buffer : str, path object, or file-like object Any valid string path is acceptable. The string could be a URL. Valid URL schemes include http, ftp, s3, and file. For file URLs, a host is expected. A local file could be: file://local
pandas.pydata.org
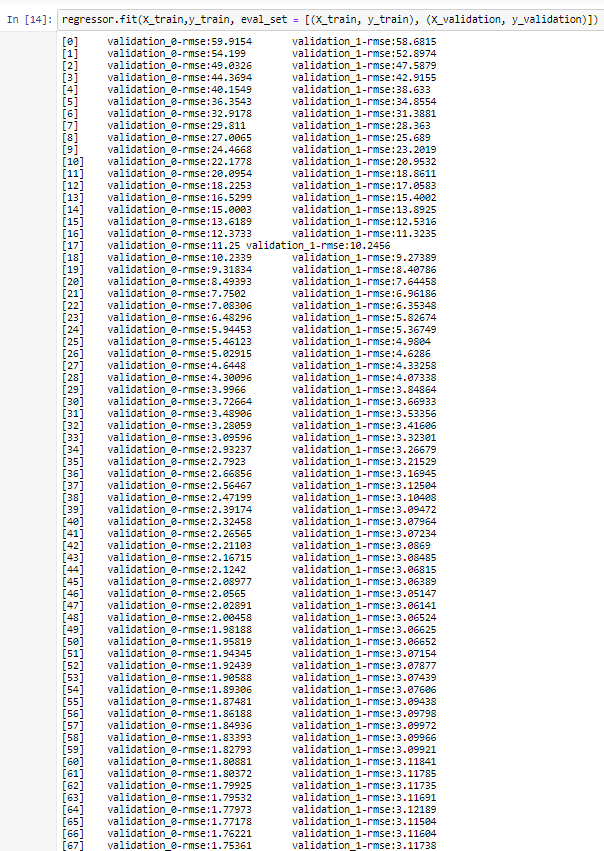
12. https://xgboost.readthedocs.io/en/latest/python/python_api.html
Python API Reference — xgboost 0.83.dev0 documentation
Python API Reference This page gives the Python API reference of xgboost, please also refer to Python Package Introduction for more information about python package. Core Data Structure Core XGBoost Library. class xgboost.DMatrix(data, label=None, missing=
xgboost.readthedocs.io
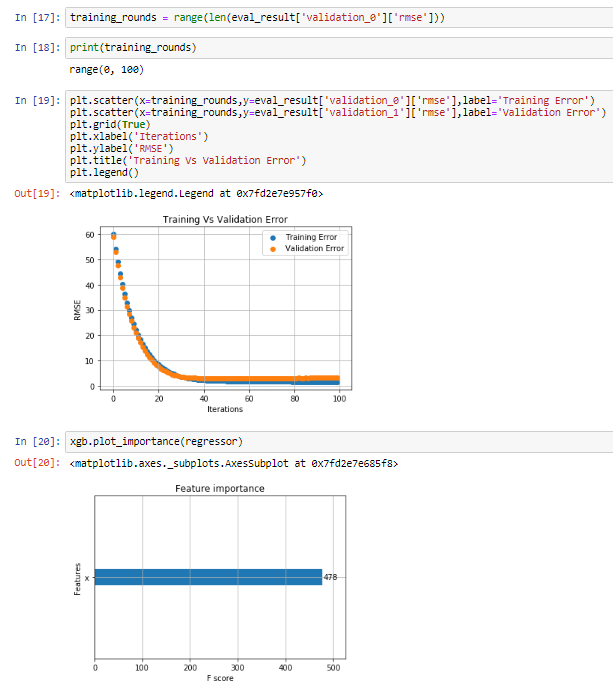
20.
Plotting API
Plotting Library.
xgboost.plot_importance(booster, ax=None, height=0.2, xlim=None, ylim=None, title='Feature importance', xlabel='F score', ylabel='Features', importance_type='weight', max_num_features=None, grid=True, show_values=True, **kwargs)
Plot importance based on fitted trees.
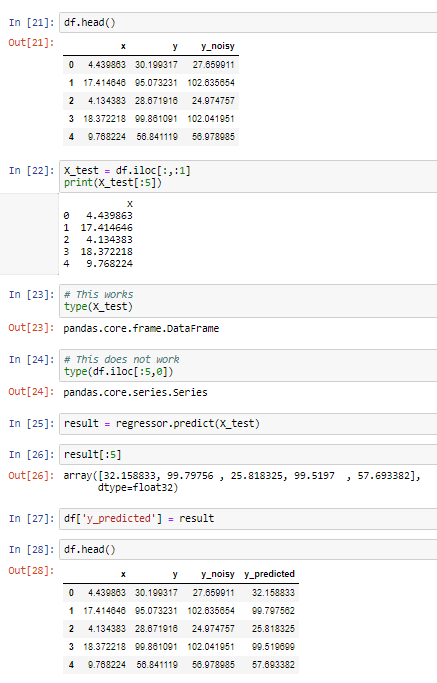
25. predict(data, output_margin=False, ntree_limit=0, pred_leaf=False, pred_contribs=False, approx_contribs=False, pred_interactions=False, validate_features=True)
Predict with data.
Note
This function is not thread safe.
For each booster object, predict can only be called from one thread. If you want to run prediction using multiple thread, call bst.copy() to make copies of model object and then call predict().
Note
Using predict() with DART booster
If the booster object is DART type, predict() will perform dropouts, i.e. only some of the trees will be evaluated. This will produce incorrect results if data is not the training data. To obtain correct results on test sets, set ntree_limit to a nonzero value, e.g.
preds = bst.predict(dtest, ntree_limit=num_round)
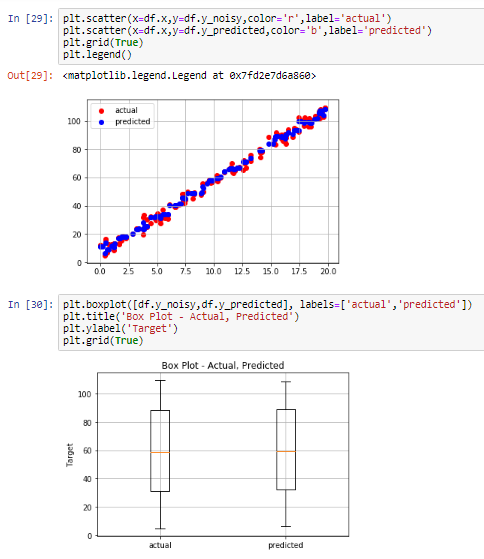
30. https://matplotlib.org/api/_as_gen/matplotlib.pyplot.boxplot.html
matplotlib.pyplot.boxplot — Matplotlib 3.0.3 documentation
Parameters: x : Array or a sequence of vectors. The input data. notch : bool, optional (False) If True, will produce a notched box plot. Otherwise, a rectangular boxplot is produced. The notches represent the confidence interval (CI) around the median. See
matplotlib.org
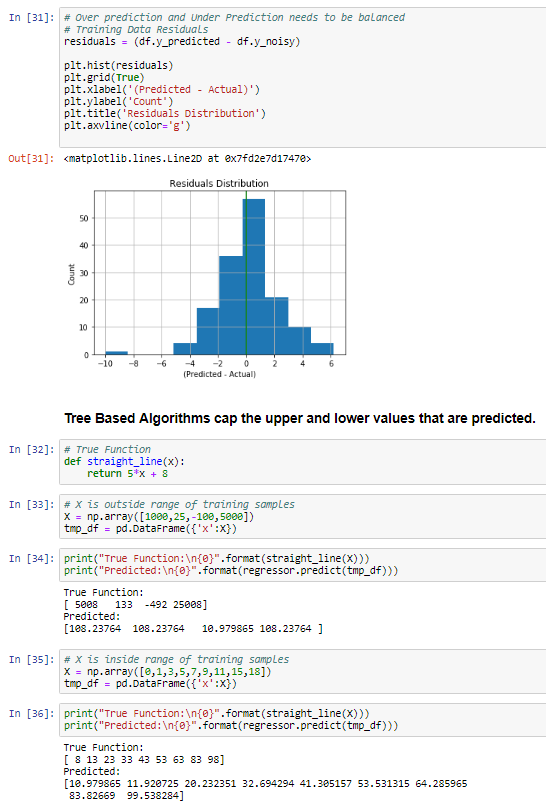
31. https://matplotlib.org/api/_as_gen/matplotlib.pyplot.hist.html
matplotlib.pyplot.hist — Matplotlib 3.0.3 documentation
Parameters: x : (n,) array or sequence of (n,) arrays Input values, this takes either a single array or a sequence of arrays which are not required to be of the same length. bins : int or sequence or str, optional If an integer is given, bins + 1 bin edges
matplotlib.org
https://matplotlib.org/api/_as_gen/matplotlib.pyplot.axvline.html
matplotlib.pyplot.axvline — Matplotlib 3.0.3 documentation
Parameters: x : scalar, optional, default: 0 x position in data coordinates of the vertical line. ymin : scalar, optional, default: 0 Should be between 0 and 1, 0 being the bottom of the plot, 1 the top of the plot. ymax : scalar, optional, default: 1 Shou
matplotlib.org
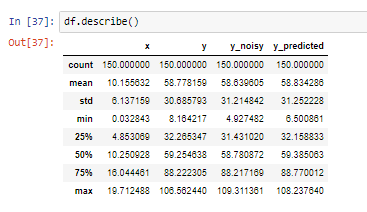
37. https://pandas.pydata.org/pandas-docs/version/0.21/generated/pandas.DataFrame.describe.html
pandas.DataFrame.describe — pandas 0.21.1 documentation
percentiles : list-like of numbers, optional The percentiles to include in the output. All should fall between 0 and 1. The default is [.25, .5, .75], which returns the 25th, 50th, and 75th percentiles. include : ‘all’, list-like of dtypes or None (default
pandas.pydata.org
'IoT > AI' 카테고리의 다른 글
| AWS SageMaker - xgboost : Create Files and and save it to S3 (0) | 2019.05.15 |
|---|---|
| AWS Machine Learning - Types of ML models etc. (0) | 2019.05.09 |
| Elements of AI - 헬싱키 대학 인공지능 강좌 듣고 Deep Learning 앱 개발하기 (0) | 2018.06.30 |
| Elements of AI - Summary (0) | 2018.06.29 |
| Elements of AI - The societal implications of AI (0) | 2018.06.29 |
| Elements of AI - About predicting the future (0) | 2018.06.27 |
| Elements of AI - Advanced neural network techniques (0) | 2018.06.25 |
| Elements of AI - How neural networks are built (0) | 2018.06.25 |
| Elements of AI - Neural network basics (0) | 2018.06.23 |
| Elements of AI - Regression (0) | 2018.06.22 |