Classroom Session 1: The Building Blocks Part 1 – Homework
Please complete this homework prior to the next class in the course. We will review the answers and
the project assigned at the beginning of the next class.
1. What tool does a fundamental analyst primarily study?
a. Charts
b. Macro‐Economics
c. Balance Sheets
d. The movements of the Fed Funds rate
==> c. Balance Sheets (재무 제표)
Fundamental Analyst는 그 회사의 기본 체력을 분석하는 것.
2. What tool does a technical analyst primarily study?
a. Charts
b. Macro‐Economics
c. Balance Sheets
d. The movements of the Fed Funds rate
==> a Charts
기술적 분석은 해당 주식의 수요와 공급을 바탕으로 패턴을 분석하는 것. 미래를 예측하는 것은 아님.
3. What are three common chart types?
==> Line, Bar, Candle charts
4. Peaks and Troughs are called?
a. Cartographic terms
b. Reversal Points
c. Connecting lines
d. Trends
==> b. Reversal Points
고점과 저점은 추세가 전환되는 시점이다.
5. How many different trend types are there?
a. One
b. Two
c. Three
d. Four
=> c. Three
upside trend, downside trend, sideways trend. 상승 추세, 하락 추세, 횡보 추세
Project:
1. Find a stock or ETF in an uptrend and draw a trend line.

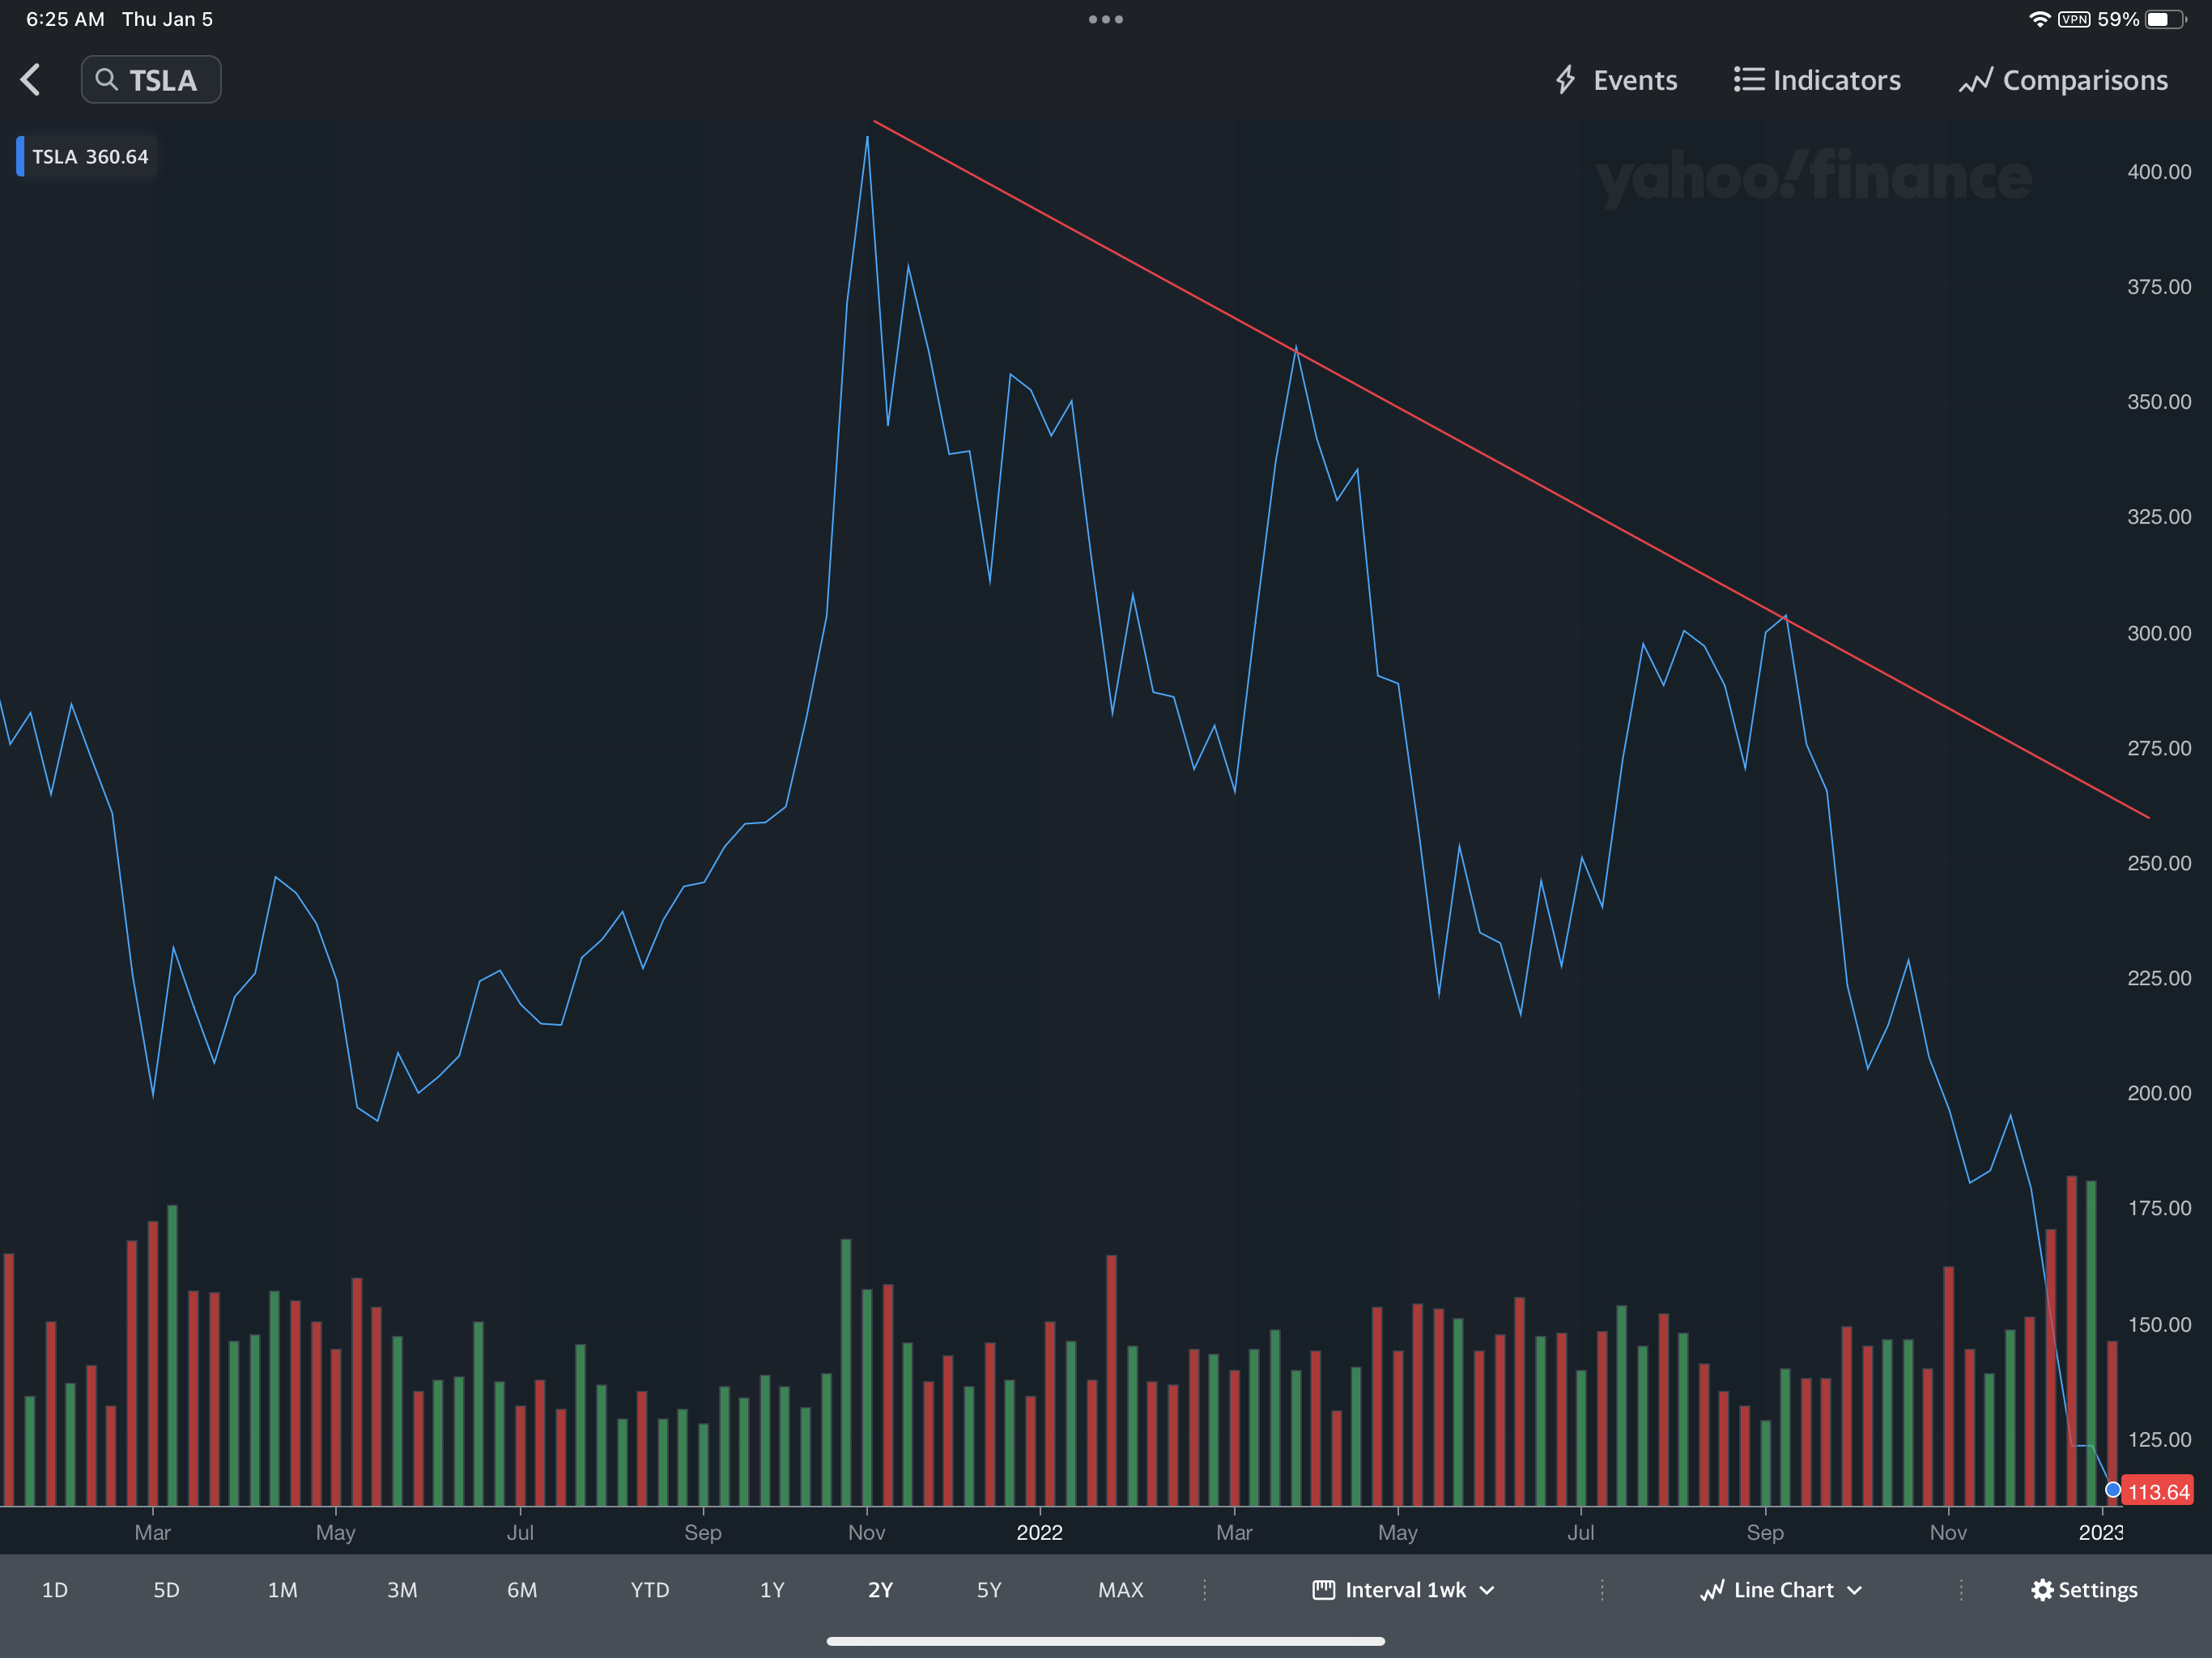
2. Find a stock or ETF in a downtrend and draw a trend line.

3. Bring up a chart and look at the chart using an OHLC (bar chart) then change the chart
to look at the same chart on a Candlestick chart. Which do you like better, why?
==> I like Candle chart because it gives more information
3a. Draw a trend line on the chart that you choose

837174.1.0
Fidelity Brokerage Services LLC, Member NYSE, SIPC, 900 Salem Street, Smithfield, RI 02917
'Financial > Technical Analysis' 카테고리의 다른 글
| 기술적 분석 - Week 4 : Identifying Chart Patterns with Technical Analysis (0) | 2023.01.25 |
|---|---|
| Week 3 Homework - Understanding technical indicator (0) | 2023.01.21 |
| 기술적 분석 - Week 3 Understanding Indicators in Technical Analysis (0) | 2023.01.21 |
| Week 2 : Building blocks Part 2 - Homework (0) | 2023.01.19 |
| 기술적 분석 - Week 1, 2 Building Blocks (0) | 2023.01.03 |

