
오늘 다룰 예제는 Visualizing the dmbeddings in 2D 입니다.
openai-cookbook/Visualizing_embeddings_in_2D.ipynb at main · openai/openai-cookbook · GitHub
GitHub - openai/openai-cookbook: Examples and guides for using the OpenAI API
Examples and guides for using the OpenAI API. Contribute to openai/openai-cookbook development by creating an account on GitHub.
github.com
여기서는 t-SNE를 사용해서 임베딩의 dimensionality (차원)dmf 1536에서 2로 줄일겁니다. 일단 임베딩이 이렇게 줄어들면 그것을 2D scattter plot (2D 산점도 플롯)을 할 수 있게 됩니다.
오늘 쓸 데이터도 fine_food_reviews_with_embeddings_1k.csv 입니다.
아래 글에서 이 데이터를 다운 받을 수 있는 방법을 설명했습니다.
Openai cookbook - Embeddings - Text comparison examples - Semantic text search using embeddings
오늘은 openai cookbook 에 있는 Embeddings 부문의 Text comparison examples 에 있는 Semantic_text_search_using_embeddings.ipynb 예제를 살펴 보겠습니다. 우선 이 예제를 살펴 보기 전에 준비해야 할 사항들이 몇가지
coronasdk.tistory.com
이 데이터를 만드는 파이썬 코드는 아래에 있습니다.
GitHub - openai/openai-cookbook: Examples and guides for using the OpenAI API
Examples and guides for using the OpenAI API. Contribute to openai/openai-cookbook development by creating an account on GitHub.
github.com
1. Reduce dimensionality
t-SNE decomposition (분해)를 사용해서 dimensionality를 2차원으로 줄입니다.
import pandas as pd
from sklearn.manifold import TSNE
import numpy as np

# Load the embeddings
datafile_path = "data/fine_food_reviews_with_embeddings_1k.csv"
df = pd.read_csv(datafile_path)

# Convert to a list of lists of floats
matrix = np.array(df.embedding.apply(eval).to_list())

# Create a t-SNE model and transform the data
tsne = TSNE(n_components=2, perplexity=15, random_state=42, init='random', learning_rate=200)
vis_dims = tsne.fit_transform(matrix)
vis_dims.shape
모듈은 pandas, numpy 그리고 sklearn.manifold의 TSNE를 사용합니다.
모두 이전 글에서 배운 모듈들 입니다.
판다스의 read_csv() 함수를 사용해서 csv 데이터 파일을 읽습니다.
그 다음 numpy 의 array()를 사용해서 csv 파일의 embedding 컬럼에 있는 값들을 리스트 형식으로 변환합니다.
그리고 TSNE()를 사용해서 계산해 줍니다.
이 함수는 고차원 데이터를 시각화 해 주는 것입니다.
sklearn.manifold.TSNE — scikit-learn 1.2.1 documentation
sklearn.manifold.TSNE
Examples using sklearn.manifold.TSNE: Comparison of Manifold Learning methods Comparison of Manifold Learning methods Manifold Learning methods on a severed sphere Manifold Learning methods on a se...
scikit-learn.org
fit_transform()은 전달받은 파라미터를 embedded space로 fit 해 주고 transformed output으로 return 합니다.
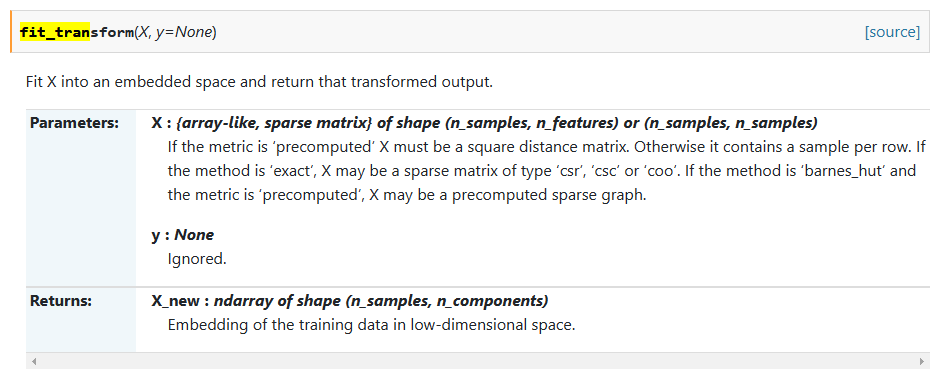
그 다음 shape으로 이 데이터의 차원이 어떤지 봅니다.
이것을 실행하면 아래와 같은 값을 얻을 수 있습니다.
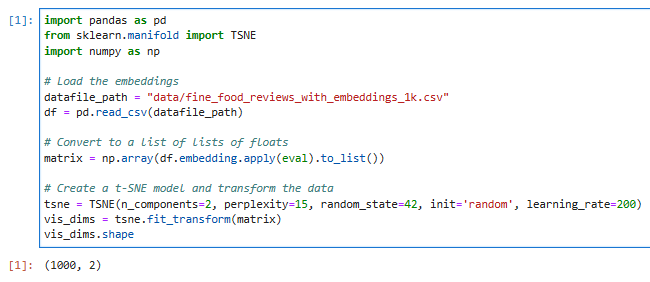
이 csv 파일의 embedding 컬럼에는 1000개의 행이 있고 그것은 2차원으로 돼 있다는 의미 입니다.
이 작업은 TSNE()에서 2차원으로 줄이는 작업을 한 것입니다.
파라미터 중 n_component=2 라고 돼 있어서 그런 겁니다.
perplexity 함수는 가장 가까운 neighbor들의 수와 관계가 있는 manifold 학습 알고리즘 입니다.
더 큰 데이터세트는는 더 큰 perplexity를 요구합니다. 5에서 50사이를 선택합니다.
random_state는 난수 생성과 관련이 있습니다.
그 다음 init은 initialization을 의미하는 것으로 임베딩을 초기화 하는 겁니다. 이 임베딩을 random 이라고 초기화 합니다.
그리고 learning_rate는 그 숫자가 너무 높을 경우 데이터의 neighbor 와의 거리를 너무 가깝게 설정하게 돼 공처럼 분포할 수 있고 너무 낮으면 빽뺵한 구름처럼 보일 수 있습니다.
이 외에도 TSNE()에서 사용할 수 있는 다른 파라미터들이 많이 있습니다.
이곳에서 확인하세요.
sklearn.manifold.TSNE — scikit-learn 1.2.1 documentation
sklearn.manifold.TSNE
Examples using sklearn.manifold.TSNE: Comparison of Manifold Learning methods Comparison of Manifold Learning methods Manifold Learning methods on a severed sphere Manifold Learning methods on a se...
scikit-learn.org
하여간 이 TSNE() 함수에서 2차원으로 줄인 겁니다.
TSNE() 함수를 이용하기 전의 matrix의 값은 아래와 같습니다.
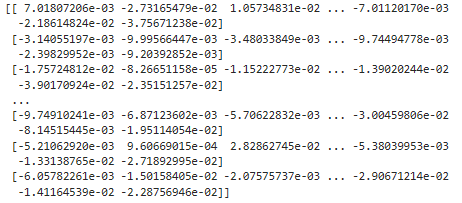
이 것을 TSNE()로 처리를 하면 이렇게 됩니다.
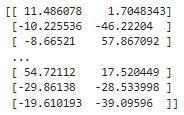
이 값을 shape을 이용해서 리스트의 크기와 차원을 표시하면 위에 처럼 1000,2 라고 나옵니다.
2. Plotting the embeddings
위에서 처럼 2차원으로 데이터를 정리하면 2D 산점도 분포도를 그릴 수 있다고 했습니다.
아래에서는 그것을 그리기 전에 알아보기 쉽도록 각 review에 대한 색을 지정해서 알아보기 쉽도록 합니다.
이 색은 별점 점수와 ranging 데이터를 기반으로 빨간색에서 녹색에 걸쳐 표현됩니다.
import matplotlib.pyplot as plt
import matplotlib
import numpy as np

colors = ["red", "darkorange", "gold", "turquoise", "darkgreen"]
x = [x for x,y in vis_dims]
y = [y for x,y in vis_dims]
color_indices = df.Score.values - 1

colormap = matplotlib.colors.ListedColormap(colors)
plt.scatter(x, y, c=color_indices, cmap=colormap, alpha=0.3)
for score in [0,1,2,3,4]:
    avg_x = np.array(x)[df.Score-1==score].mean()
    avg_y = np.array(y)[df.Score-1==score].mean()
    color = colors[score]
    plt.scatter(avg_x, avg_y, marker='x', color=color, s=100)

plt.title("Amazon ratings visualized in language using t-SNE")
matplotlib 모듈도 visualization 관련 모듈입니다.
이 모듈은 numPy 라이브러리와 같이 많이 쓰입니다.
Matplotlib — Visualization with Python
Matplotlib — Visualization with Python
seaborn seaborn is a high level interface for drawing statistical graphics with Matplotlib. It aims to make visualization a central part of exploring and understanding complex datasets. statistical data visualization Cartopy Cartopy is a Python package des
matplotlib.org
[CCTV] 5.matplotlib기초 (tistory.com)
[CCTV] 5.matplotlib기초
서울시 CCTV 분석하기 프로젝트 5. matplotlib기초 matplotlib란? 파이썬의 대표 시각화 도구 Matplotlib는 Python 프로그래밍 언어 및 수학적 확장 NumPy 라이브러리를 활용한 플로팅 라이브러리이다. Tkinter ,
ruby-jieun.tistory.com
필요한 모듈들을 import 한 후에 colors 라는 배열에 5가지 색을 지정했습니다.
그리고 위에서 만들었던 vis_dims 데이터의 값을 x 와 y 변수에 넣습니다.
그러면 2차원으로 축소시킨 임베딩 값의 x는 x 변수에 y는 y 변수에 따로 담깁니다.
그리고 데이터 파일의 Score 컬럼에 있는 값에서 1을 뺀 숫자를 color_indices에 넣습니다.
다음줄에 있는 matplotlib.colors.ListedColormap() 은 칼라 리스트로부터 Colormap object를 생성하는 함수입니다.
matplotlib.colors.ListedColormap — Matplotlib 3.7.0 documentation
matplotlib.colors.ListedColormap — Matplotlib 3.7.0 documentation
Number of entries in the map. The default is None, in which case there is one colormap entry for each element in the list of colors. If the list will be truncated at N. If the list will be extended by repetition.
matplotlib.org
5.차원 축소를 사용한 데이터 압축, 머신러닝교과서, python (tistory.com)
5.차원 축소를 사용한 데이터 압축, 머신러닝교과서, python
* 본 포스팅은 머신러닝교과서를 참조하여 작성되었습니다. 5.1 주성분 분석을 통한 비지도 차원 축소 특성 선택 vs 특성 추출 - 원본 특성을 유지한다면 특성 선택 - 새로운 특성 공간으로 데이터
justgwon.tistory.com
다음에 나오는 함수는 matplotlib.pyplot.scatter 함수입니다. 데이터를 좌표에 점으로 표현하는 함수 입니다.
matplotlib.pyplot.scatter — Matplotlib 3.7.0 documentation
matplotlib.pyplot.scatter — Matplotlib 3.7.0 documentation
Fundamentally, scatter works with 1D arrays; x, y, s, and c may be input as N-D arrays, but within scatter they will be flattened. The exception is c, which will be flattened only if its size matches the size of x and y.
matplotlib.org
x,y 값과 컬러, 마커모양 line 두께, 테두리 선, 투명도 등을 정의하는 파라미터들을 사용할 수 있습니다.
Matplotlib의 Pyplot 모듈로 Scatter Plot 그리기 (glanceyes.com)
Matplotlib의 Pyplot 모듈로 Scatter Plot 그리기
2022년 2월 3일(목)부터 4일(금)까지 네이버 부스트캠프(boostcamp) AI Tech 강의를 들으면서 개인적으로 중요하다고 생각되거나 짚고 넘어가야 할 핵심 내용들만 간단하게 메모한 내용입니다. 틀리거
glanceyes.com
좌표위에 점으로 표시하면 그 거리에 따라서 좀 더 가까운 것과 먼것 그리고 가까운 것들의 군집, 다른 군집들과 동떨어져 있는 특정 군집이나 특정 데이터 등을 알 수 있습니다.
여기까지 하면 아래와 같은 산점도가 표시 됩니다.
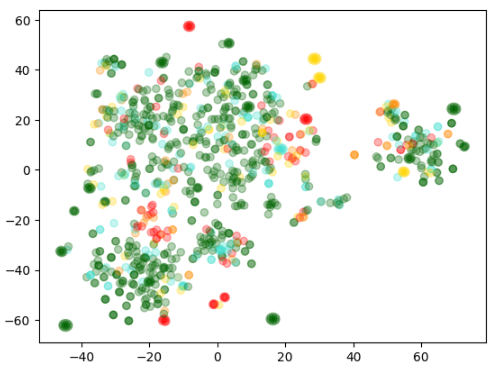
1000 개의 점이 있을 겁니다. 2차원화된 임베딩 값을 x,y값으로 해서 표시한 것입니다.
다음 나오는 for 루프는 5번 돕니다. 별점이 1점부터 5점까지 5가지가 있기 때문입니다.
위에 color_indices 에서 별점 - 1을 했기 때문에 값은 0~4까지의 숫자들이 있게 됩니다.
여기서 하는 일은 각 별점별로 평균을 내서 좌표로 표시하는 겁니다.
보시면 마커는 X로 돼 있습니다.
이 부분만 따로 표시를 하면 아래와 같이 됩니다.
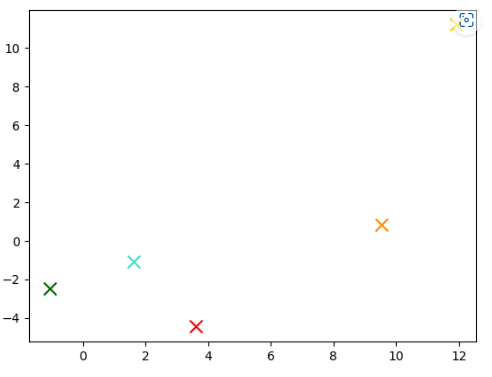
각 별점별 평균 값은 좌표상 위와 같이 찍힙니다.
그러면 아까 위에 있었던 산점도와 이 별점별 평균 산점도를 같이 표시 하겠습니다.
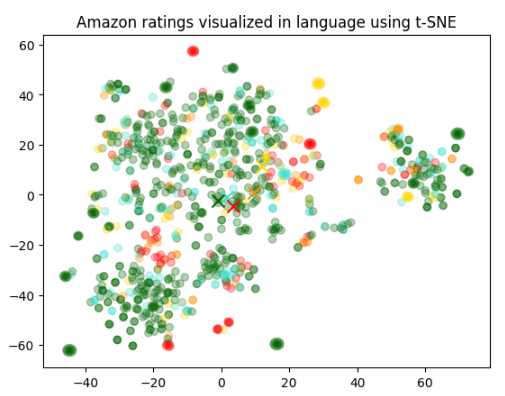
위와 같이 나타납니다.
각 별점별 평균 위치와 각 데이터별 위치가 색깔별로 표시 돼 있습니다.
데이터들이 40 근처에는 별로 없습니다.
그리고 별점별 평균은 0-20 사이에 주로 몰려 있구요.
데이터들 중 40-60 사이의 것들이 이 평균과는 좀 떨어져서 군집을 이루고 있네요.
그 안의 별점별 분포도는 특이성을 띄는 것 같지는 않습니다. 다만 빨간색이 거의 없네요.
이런 식으로 임베딩 데이터를 t-SNE 로 2차원으로 바꾼 다음 matplotlib.pyplot 으로 시각화 해서 2D로 표시하는 것이 이 예제에서 보여 주는 것 입니다.
openai api 에서 받은 임베딩 데이터를 2D 로 시각화 하는 예제였습니다.
openai-cookbook/Visualizing_embeddings_in_2D.ipynb at main · openai/openai-cookbook · GitHub
GitHub - openai/openai-cookbook: Examples and guides for using the OpenAI API
Examples and guides for using the OpenAI API. Contribute to openai/openai-cookbook development by creating an account on GitHub.
github.com

