
Using Jupyter Notebook for analysing DeepRacer's logs
Using Jupyter Notebook for analysing DeepRacer's logs - Code Like A Mother
Training a model for DeepRacer involves getting a lot of data and then while you can ignore it, you can also analyze it and use for your own benefit.
codelikeamother.uk
Training a model for DeepRacer involves getting a lot of data and then while you can ignore it, you can also analyze it and use for your own benefit.
Training a model for DeepRacer involves getting a lot of data and then while you can ignore it, you can also analyze it and use for your own benefit.
DeepRacer 모델을 교육하려면 많은 양의 데이터를 가지고 분석한 후 여러분의 모델의 성능향상을 위해 사용하는 것도 필요합니다.

You can spend an hour watching the stream as your car trains and observing its behaviour (and I've done it myself before), but you might not have the time to do this. Also, you might blink, you know? Finally, if your car is fast, like really fast, it could do all 5 evaluation laps in one minute. First you wait 4-7 minutes for the evaluation to start, then you see it take 4-7 minutes to stop. Video? Sorry, you've missed it.
차를 한 시간 훈련하는 동안 스트림을 보면서 그 차의 행동을 관찰할 수도 있습니다 (예전엔 저도 이렇게 했습니다.) 하지만 항상 이렇게 시간이 충분이 있지는 않을 겁니다. 또한 당신이 눈을 깜빡이는 동안 무엇인가를 놓칠 수 있죠. 당신의 차가 정말 정말 빠르다면 1분 안에 5번의 평가를 끝낼 수도 있습니다. 일단 평가작업이 시작하기 까지 4~7분을 기다려야 합니다. 그리고 나서 완료 될 때까지 4~7분을 기다립니다. 비디오요? 안 됐지만 당신을 그것을 볼 기회를 놓쳤습니다.
Yeah, I'm stretching this a bit too far. Having data you can plot, compile, transform and replay over and over again will always be a handy solution. That's why I love what guys at Amazon have shared in the DeepRacer workshop repository (link takes you to GitHub).
네, 제가 설명을 질질 끌고 있네요. 데이터를 가지고 플롯, 컴파일, 변환 및 재생하는 방법이 훨씬 더 편리할 겁니다. 그래서 아마존의 사람들이 DeepRacer 워크샵 저장소 (GitHub로 연결되는 링크)를 공유 하는 것을 저는 좋아합니다.
Log analysis
While we're here, I hope you'll like this post. Once you're done reading, I'd like to recommend reading about what I have come up with based on this tool in "Analyzing the AWS DeepRacer logs my way" - it might help you and give a couple ideas for your own modifications.
이 글이 당신에게 도움이 되길 바랍니다. 일단 읽고 나면, "AWS DeepRacer 로그 분석하기"에서이 도구를 기반으로 작성한 내용을 읽어 보는 것을 추천합니다. 그 글을 읽으면 여러모로 도움이 될 수 있으며 자신 만의 modifications를 위한 몇 가지 아이디어를 얻을 수 있을 겁니다.
The tools provided include a couple functions to help working with the data, track data, a Jupyter notebook that leads you through the analysis and some sample data.
제공된 도구에는 데이터 작업, 데이터 추적, 분석 및 샘플 데이터를 안내하는 Jupyter 노트북을 지원하는 몇 가지 기능이 포함되어 있습니다.
It lets you assemble aggregated information about your car's performance, plot its behaviour on the track, plot reward values depending on the car's location during evaluation, plot the route during the evaluation (including the virtual race evaluation), analyse the behaviour depending on the visual input, detect which pieces of image matter to the car the most.
그것은 당신이 다음과 같은 정보를 집계해서 assemble 하도록 합니다. '자동차의 퍼포먼스', 트랙에서의 행동에 대한 플롯', '평가 기간 동안 자동차의 위치에 근거한 reward 값에 대한 픞롯', '평가 기간 동안 (virtual race evaluation을 포함) route에 대한 plot', 'visual input에 근거한 행동 분석', '자동차에 어떤 image matter들이 가장 많이 탐지 되는지' 등등.
I may have lost my skills in statistics and might not be able to predict future trends based on the time series anymore (I still remember that the classic linear regression model is calculated with ((X'X)^(-1))X'y, I still have dreams of econometrics lectures with Professor Osiewalski), but I can appreciate good statistics when I see them. The guys at Amazon have provided an excellent tool that I have used before to present some images to you. I didn't however know what the ipynb file provided with the tools was. I mean, I managed to open it (GitHub comes with a viewer), but it wasn't until the AWS Summit that I actually installed Jupyter Notebook and understood what power it gives me. Nice!
나는 통계에서 나의 기술을 잃어 버렸을지도 모른다. 그리고 더 이상 time series에 기초한 미래의 추세를 예측할 수 없을지도 모른다. (나는 고전적인 linear regression model이 (X'X) ^ (- 1) X ' y로 계산된다는 것을 아직 기억하고 있다. 나는 아직 Osijalski 교수의 econometrics 강의를 꿈꾸고 있다.) 그러나 나는 좋은 통계를 볼 때 그것에 고마와 한다. 아마존의 사람들은 내가 당신에게 이미지를 보여주기 위해 사용했던 훌륭한 도구를 제공했습니다. 그러나 ipynb 파일이 제공 한 도구가 무엇인지는 알지도 못했습니다. 내 말은, 나는 그것을 오픈하기는 했지만 (GitHub에는 뷰어가 포함되어 있음), 내가 실제로 Jupyter Notebook을 설치하고 그것이 가지고 있는 강력함을 이해하게 된 것은 AWS Summit이었다. Nice!
Summit
Jupyter Notebook is a web application that provides an editor for files containing formatted text, code and its latest results. It can be either hosted or run locally. AWS provides a solution to view notebooks within the SageMaker, but if you tend to leave stuff lying around like me, I wouldn't recommend this solution. The pricing of it matches its usefulness and I tell you, this is a really, really useful tool. I'm exaggerating here, but it does add up if you leave the EC2 running.
Jupyter Notebook은 형식이 지정된 텍스트, 코드 및 그것들의 최신 결과를 포함하는 파일에 대한 편집기를 제공하는 웹 application입니다. 호스팅되거나 로컬에서 실행될 수 있습니다. AWS는 SageMaker에서 노트북을 볼 수있는 솔루션을 제공하지만 나처럼 물건을 놓고 다니는 경향이 있다면이 솔루션을 권장하지 않습니다. 나는 그것이 가성비 면에서 좋다고 생각한다. 그것은 정말 정말 정말 유용한 툴이다. 조금 과장하는 면이 있지만 만일 당신이 EC2를 달리게 내버려두면 그것은 add up된다.
The code can be in one of many languages, python included. I think more interesting stuff will come out of actually using the notebook.
코드는 파이썬을 포함해 다른 많은 언어로 작성될 수 있다. 실제로 노트북을 사용하면 훨씬 더 흥미로운 사실들을 만나보게 될 것이다.
Installation
To install it you need to be familiar with either Python or Anaconda. You will find the installation instructions on their website. I'll leave you with this, I am assuming that if you're here and still reading, you know how to install a Python interpreter and how to install modules.
설치하려면 Python 또는 Anaconda에 익숙해야합니다. 웹 사이트에서 설치 지침을 찾을 수 있습니다. 일단 파이썬 인터프리터를 설치하는 방법과 모듈을 설치하는 방법을 알고 있다고 가정하겠습니다.
Remeber you can also use Docker if you're familiar with it. This document (takes you to Jupyter documentation) describes how to do that. I think Tensorflow notebook docker image is the closest to what you need to run log analysis notebook without installing everything around.
익숙하다면 당신은 또한 Docker를 사용할 수 있습니다. 이 문서 (Jupyter 문서로 이동)는 이를 수행하는 방법을 설명합니다. Tensorflow notebook docker image는 모든 것을 설치하지 않고도 로그 분석 노트북을 실행하는 데 가장 가까운 이미지라고 생각합니다.
Note: I am referring to instructions which in most cases contain details for Linux/Mac/Windows. I use Linux and so might miss the shortcomings of how other systems are described, but they do look well written. I am also assuming that you have some level of confidence working either with Python/pip or Anaconda/conda. In case of Python I use Python 3 and I recommend using it. It's time for Python 2.7 to go.
참고 : 대부분의 경우 Linux / Mac / Windows에 대한 세부 정보가 포함 된 지침을 언급하고 있습니다. 나는 리눅스를 사용하기 때문에 다른 시스템이 어떻게 기술되는지에 대한 단점을 놓치지 만 잘 작성된 것처럼 보인다. 나는 또한 당신이 Python / pip 또는 Anaconda / conda로 어느 정도 자신감을 가지고 있다고 가정하고 있습니다. 파이썬의 경우에는 파이썬 3을 사용합니다. 파이썬 2.7이 나올 때입니다.
Project structure
In the log-analysis folder you will find a couple things: log-analysis 폴더에는 다음과 같은 것들이 있습니다.
- intermediate_checkpoint - folder for data used in some of the analysis
- logs - folder for the logs
- simulation_episode - you'll be downloading images from the simulation to understand what actions the car is likely to take
- tracks - folder for the tracks points
- DeepRacer Log Analysis.ipynb - the notebook itself
- cw_utils.py - utility methods for downloading of logs
- log_analysis.py - utility methods for the analysis
Dependencies to run log-analysis
Before we continue with running the notebook itself, let's have a look at the required dependencies that you can install using pip:
노트북을 계속 실행하기 전에 pip를 사용하여 설치할 수있는 관련된 필수 요소들을 살펴 보겠습니다.
- boto3 - python library for interacting with AWS
- awscli - not really needed, but useful - I used it to run aws configure and set up default access to AWS. Once I've done this, I didn't have to provide credentials in code. Click here for installation instructions, then click here for configuration instructions. Remember DeepRacer region is us-east-1. Click here for instructions to set up an IAM user. The roles listed in a page linked there do not provide permissions needed to get a list of streams in a log group, I've learned this one is part of role CloudWatchLogFullAccess or something like that. This is somewhat excessive so you might just want to apply permission DescribeLogStreams
- numpy, pandas, matplotlib, shapely, sklearn, glob - plotting, listing, showing nice numbers
- numpy, tensorflow, PIL, glob - analysis of actions probability (picture to action mapping)
- cv2, numpy, tensorflow, glob - analysis of an image heatmap (what the car cares about when processing the picture)
Some of those will already be available in your Python/Anaconda bundle or venv evironment. Others you should install yourself.
그 중 일부는 이미 Python / Anaconda 번들 또는 venv 환경에서 사용할 수 있습니다. 다른 것들은 직접 설치해야합니다.
I may write a bit more about some of them at some point.
나는 그들 중 일부에 대해 좀 더 자세히 기술 할 것이다.
Running the notebook
We could have done that earlier, but I like being prepared.
이전에 다룬적이 있지만 다시 설명하겠습니다.
To run the notebook, go to the log-analysis folder in a terminal and run:
notebook을 실행하려면 터미널에서 log-analysis 폴더로 가서 다음을 실행하세요.
jupyter notebook 'DeepRacer Log Analysis.ipynb'
A browser will open with a Jupyter notebook.
그러면 브라우저가 열리면서 주피터 노트북이 실행 될 겁니다.
Running the code
The editor will look more or less like that: 편집기는 아래와 같이 생겼을 겁니다.
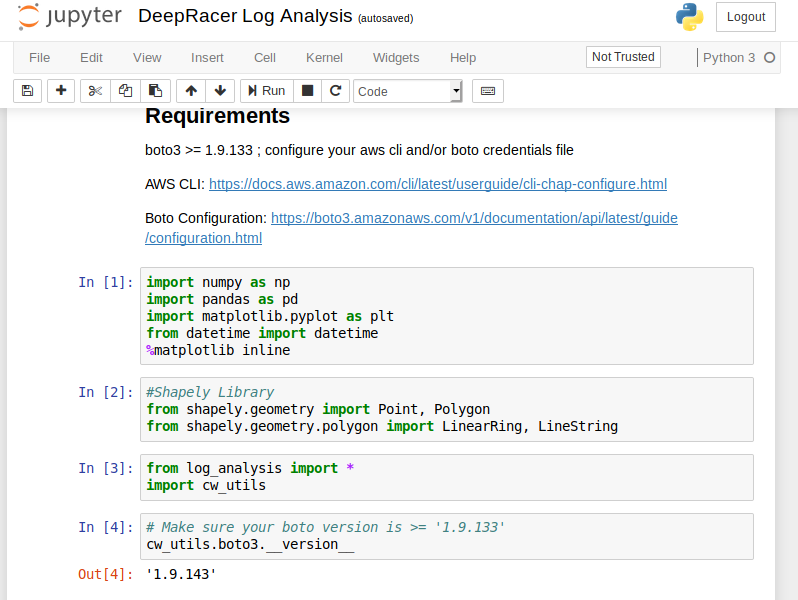
The usual stuff: some text, a toolbar, a menu, some code.
When you get on the code section and press "Run" in the toolbar, the code executes, output (if available) gets printed out. That's pretty much how you go through the document: read, execute, analyse results of the code run.
코드 섹션에서 도구 모음의 "실행"을 누르면 코드가 실행되고 출력 (사용 가능한 경우)이 인쇄됩니다. 코드를 실행하고 결과를 읽고, 실행하고, 분석합니다.

You can find a couple more hints about working with Jupyter notebooks in a short document about using notebooks.
Jupyter Notebook Viewer
The second idea of mouse based navigation is that cell actions usually apply to the currently selected cell. Thus if you want to run the code in a cell, you would select it and click the button in the toolbar or the "Cell:Run" menu item. Similarly, to copy
nbviewer.jupyter.org
노트북 사용에 관한 간단한 문서에서 Jupyter 노트북으로 작업하는 것에 대한 몇 가지 힌트를 찾을 수 있습니다.
Analysis
When you start working with your notebook, be sure to execute the code blocks with imports at the top. They also include an instruction to display plotted images in the notebook.
notebook 작업을 시작할 때는 코드 블록 위에 imports를 먼저 한 후에 실행해야 합니다. 또한 노트북에 플롯 된 이미지를 표시하는 지침도 포함됩니다.
The files currently available in the data folders are samples. You will be using your own and downloading them as you go through the notebook.
현재 데이터 폴더에서 사용할 수있는 파일은 샘플입니다. 노트북을 사용하면서 당신의 파일을 다운로드 할 겁니다.
The notebook itself has quite a bit of helping code in it like the mentioned downloading of logs or loading the track info. I will not be covering it here.
노트북 자체는 위에서 언급 한 로그 다운로드 나 트랙 정보로드와 같이 코드 자체에 도움이되는 코드를 가지고 있습니다. 나는 여기서 그것을 다루지는 않을 것이다.
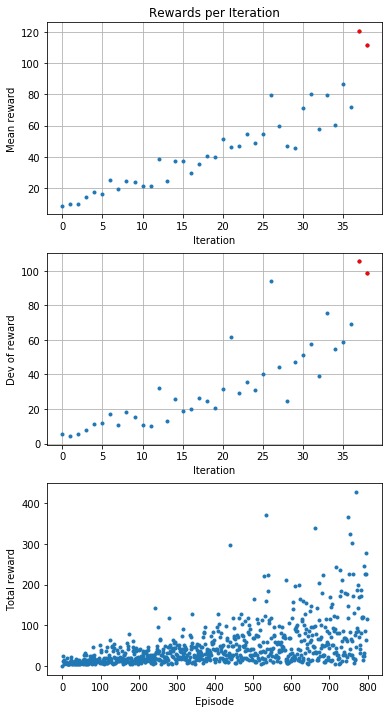
Plot rewards per Iteration
This analysis takes the rewards and calculates mean and standard deviation. It then displays those values per iteration. Also a reward per episode is presented.
이 분석은 보상을 취하고 평균 및 표준 편차를 계산합니다. 그런 다음 반복 당 값을 표시합니다. 에피소드 당 보상도 표시됩니다.
Analyze the reward function
The next section uses the track data and training logs to display where the car goes and what reward it receives.
다음 섹션에서는 트랙 데이터와 트레이닝 로그를 사용하여 자동차가 가는 곳과 받는 보상을 표시합니다.
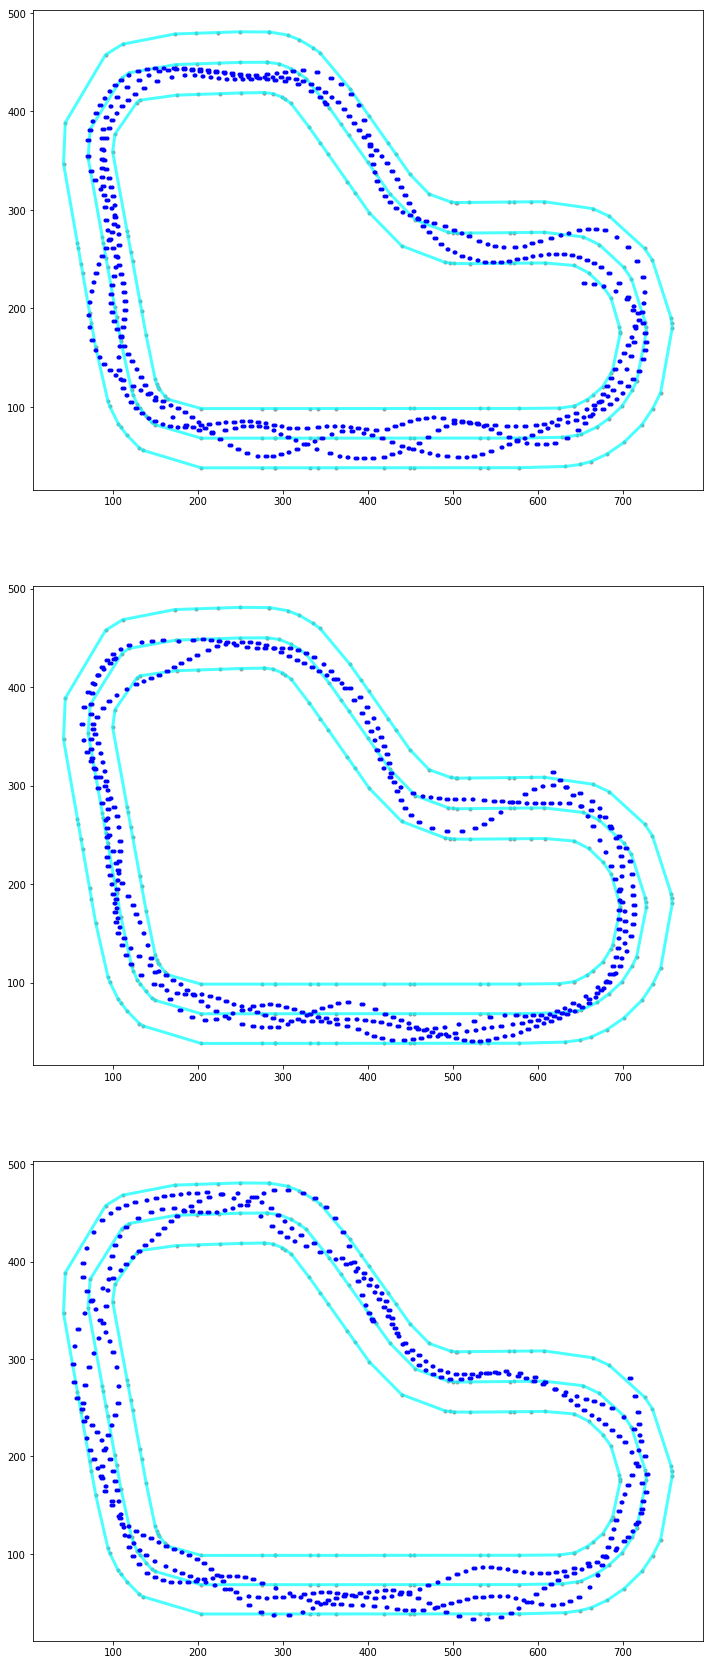
You can display all the points where the car had a reward function calculated:
자동차에 보상 기능이 계산 된 모든 지점을 표시 할 수 있습니다.
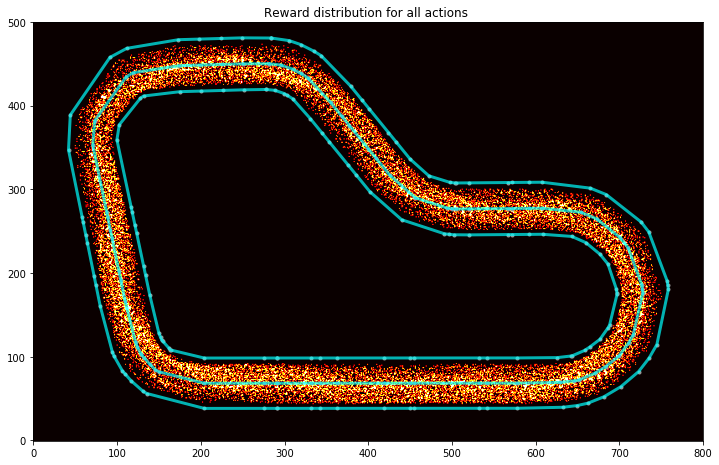
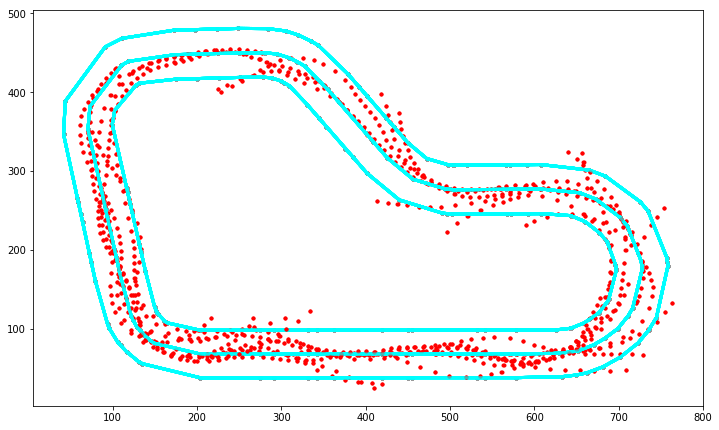
In this one above you can see how the car is all over the place. But then have a look at this one (this is a reward distribution for my AWS Summit London model):
위 그림을 보면 차가 여기 저기 많이 다녔다는 것을 알 수 있습니다. 그런데 이걸 한번 봐 보세요. (이것은 AWS Summit London 모델의 reward distribution입니다).
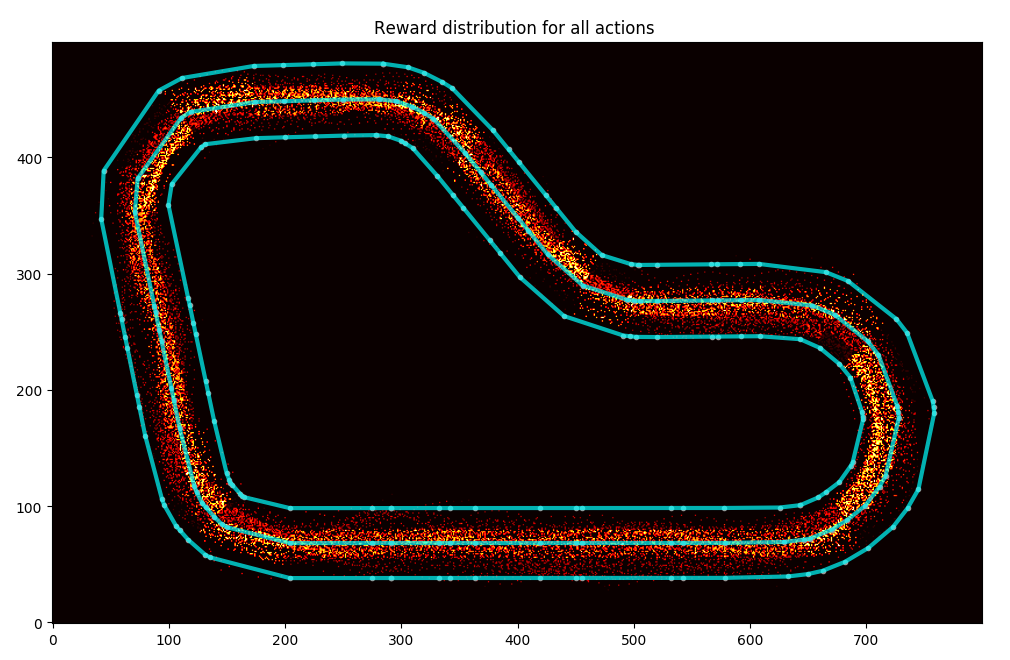
As you can guess, I trained my model to cut corners and to go straight on the straight line.
짐작할 수 있듯이, 나는 내 모델을 코너에서는 안쪽으로 돌고 직선도로에서는 똑바로 가도록 훈련했습니다.
You can display a specific iteration:
이렇게 특정 iteration을 표시할 수 있습니다.

You can get top iterations and analyse the path taken:
top iterations 에서 통과한 길을 분석할 수도 있습니다.
Or just a particular episode: 특정 에피소드만을 볼 수도 있고

Or maybe a particular iteration: 또는 특정 iteration만을 볼 수도 있습니다.
Actions breakdown
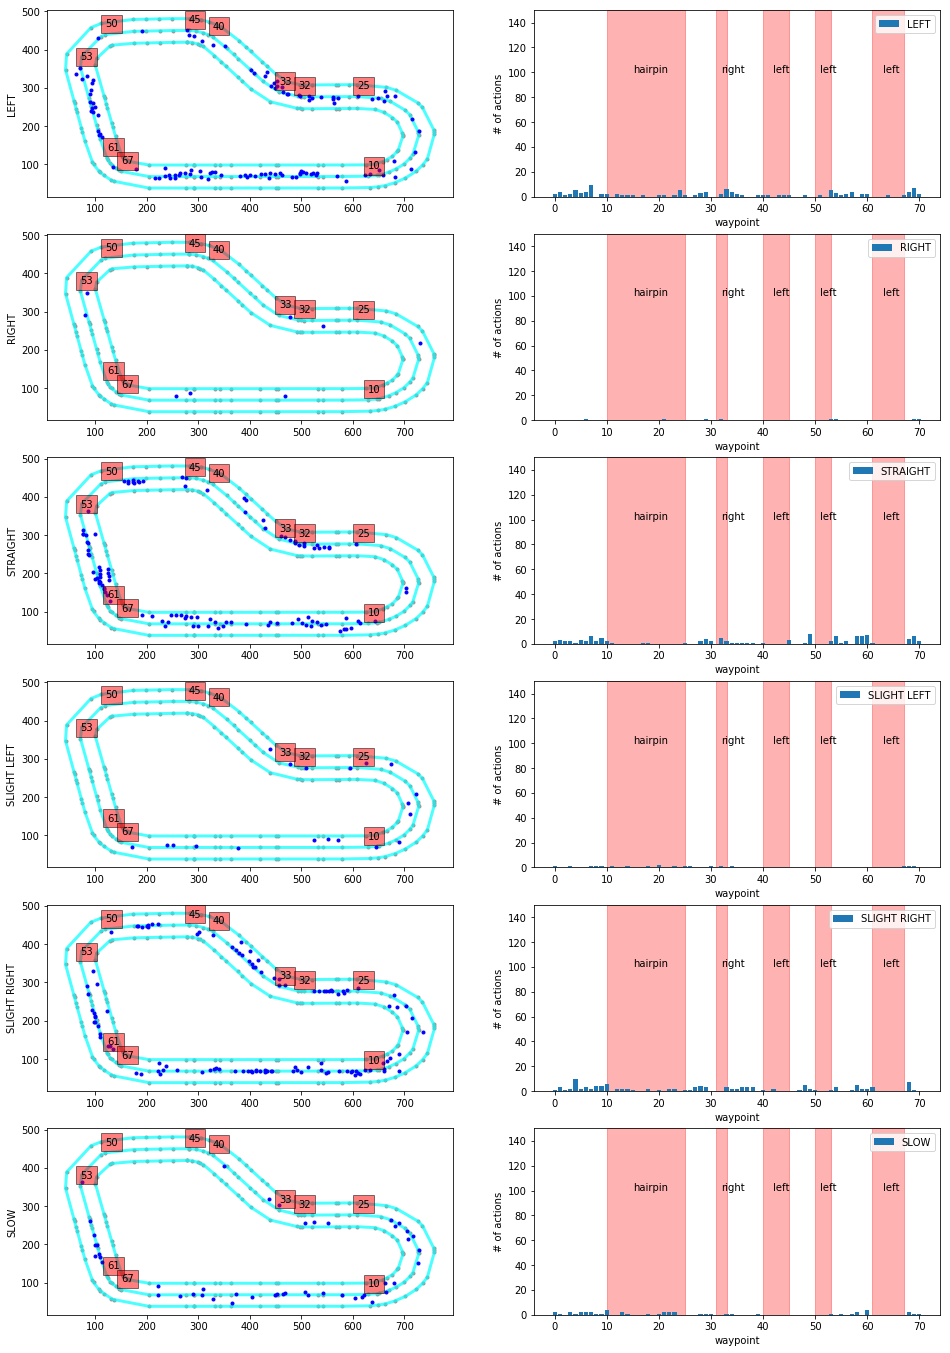
This function is pretty damn impressive, but applicable to the re:invent track only. I might spend some time and make something similar for the London Loop.
이 기능은 상당히 인상적이지만 re : invent 트랙에만 적용됩니다. London Loop에서도 비슷하게 시간을 투자해서 비슷한 그림들을 만들어 낼 수도 있습니다.
The output of this function is a graph of decisions taken in different parts of the track. The track is broken down into sections like turns and stuff, then the car's decision process is evaluated and displayed on a histogram. This may help you spot undesired decisions and discourage the car from taking them going forward. Just bear in mind that some wrong actions have a rather low impact and therefore it might be not worth training away from them as you might overtrain.
이 기능의 출력은 트랙의 다른 부분에서 취해진 결정의 그래프입니다. track은 sections으로 나눠집니다. 그리고 나서 자동차에 결정과정은 평가되고 히스토그램에 표시됩니다. 이것을 통해 여러분은 원하지 않는 결정을 찾아내고 앞으로는 자동차가 그런 결정을 하지 않도록 할 수 있게 도와 줍니다. 어떤 잘못된 행동은 영향이 미미할 수 있습니다. 그것들을 너무 과도하게 훈련 시키면 별로 효과가 없을 수도 있습니다.
Simulation Image Analysis
In here you will be loading trained models, loading screens from simulation and observing probability of taking a particular action.
여기에서는 숙련 된 모델을 로드하고, 시뮬레이션에서 화면을 로드하고, 특정 작업을 수행 할 probability 을 관찰합니다.
First you need to download the intermediate checkpoints, then load the session model from the file. The final graph displays separation of probability of taking particular actions. If I understand properly, this can be used to determine how confident the model is about taking a specific action. The bigger difference from the best to second-best action, the better.
먼저 intermediate checkpoints를 다운로드 한 다음 파일에서 세션 모델을로드해야합니다. 마지막 그래프는 특정 동작을 취할 probability 의 separation 를 표시합니다. 내가 제대로 이해한다면, 이것은 모델이 특정 행동을 취하는 것에 대한 confident 을 결정하는 데 사용될 수 있습니다. 최선책과 차선책 행동의 차이가 크면 클수록 좋습니다.
I haven't used it before. I guess it will be handy when I understand more of it.
나는 전에 이것을 사용하지 않았습니다. 이것에 대해 더 많은 것을 이해할수록 좀 더 편리하게 사용할 수 있을 겁니다.
Model CSV Analysis
I don't really get this one, sorry. I thin it's just about downloading some metadata about the training and showing distribution of rewards and length of episode (the longer the episodes, the more stable the model.
죄송하지만 이 부분은 제가 제대로 이해하지 못했습니다. 나는 훈련에 대한 메타 데이터를 다운로드하고 보상의 분배와 에피소드의 길이를 보여주는 것에 관한 것이라고 생각합니다 (에피소드가 길수록 모델이 더 안정적입니다).
I will have to learn to understand it better. The description says about downloading the model from DeepRacer Console, but the analysis is happening on some csv file only. Maybe it's part of the model archive?
이것을 더 잘 이해하는 법을 배워야 할 것 같습니다. DeepRacer Console에서 모델을 다운로드하는 것에 대한 설명이 있지만 분석은 일부 CSV 파일에서만 발생합니다. 어쩌면 모델 아카이브의 일부일까요?
Evaluation Run Analysis
This is specifically useful since you can look at your evaluations both in the console and in the virtual race.
이것은 콘솔과 가상 레이스에서 평가를 볼 수 있으므로 특히 유용합니다.
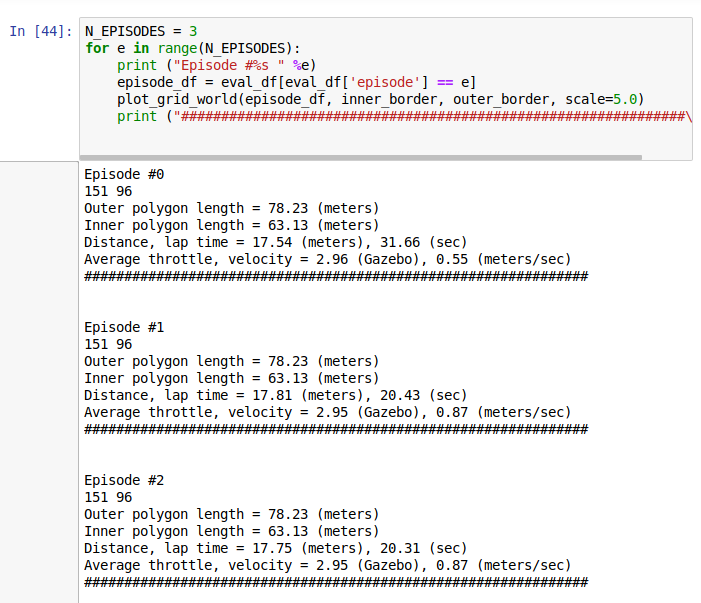
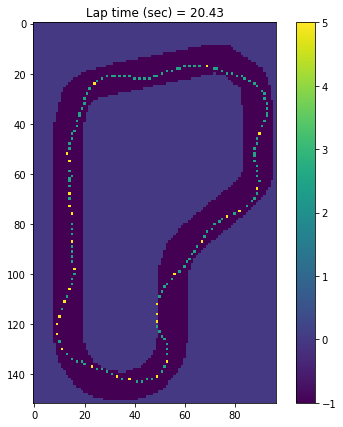
You can load logs from evaluation, then plot them on the track to see the path taken, distance covered, time, average throttle, velocity etc.
평가에서 로그를 로드 한 다음 트랙에 그려서 경로, 거리, 시간, 평균 스로틀, 속도 등을 확인할 수 있습니다.
On the plotted images you can see what throttle decision the car has taken.
플롯 된 이미지에서 자동차가 취한 throttle 결정을 볼 수 있습니다.
Just being able to compare faster and slower results from the evaluation can be very useful in terms of making decisions on future training sessions.
보다 빠르고 느린 평가 결과를 비교할 수 있다면 향후 교육 세션에 대한 결정을 내리는 데 매우 유용 할 수 있습니다.
What is the model looking at
I haven't used this one yet and I treat it more like a helpful utility to understand what the model cares about. After loading a model and some images, it is possible to get a processed image with highlighted elements that are of value when making decisions. It looks like that:
나는 이것을 아직 사용하지 않았으며 모델이 무엇을 중요하게 생각 하는지를 이해하는 데 도움이되는 유틸리티처럼 취급합니다. 모델 및 일부 이미지를로드 한 후에는 결정할 때 가치가있는 강조 표시된 요소가있는 처리 된 이미지를 가져올 수 있습니다. 그것은 다음과 같이 보입니다.
Example
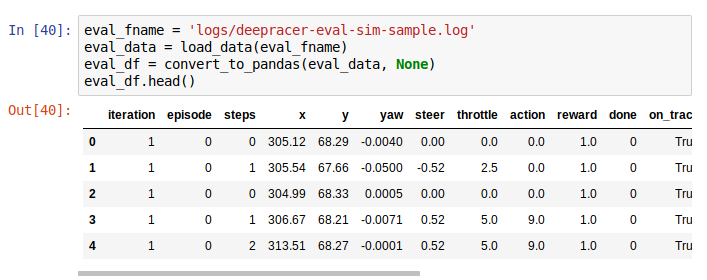
Let's say I want to analyse one of my virtual race evaluations. I want to see the race information from when I managed to do the 23 seconds. I located the log stream starting with sim-ynk2kzw3q7lf, located in /aws/deepracer/leaderboard/SimulationJobs.
내 가상 경주 평가 중 하나를 분석하려고한다고 가정 해 봅시다. 나는 23 초를 할 수 있었을 때부터 경주 정보를보고 싶다. / aws / deepracer / leaderboard / SimulationJobs에있는 sim-ynk2kzw3q7lf로 시작하는 로그 스트림을 찾았습니다.
Then load the track data: 그리고 트랙 데이터를 로드 합니다.
Then fetch the evaluation data and plot it (some small corrections to the code needed):
그런 다음 평가 데이터를 가져 와서 플롯합니다 (코드에 약간의 수정이 필요함).
The result comes as a scrollable frame. It's quite annoying and can be expanded by a single click on the left margin:
결과는 스크롤 가능한 프레임으로 제공됩니다. 매우 성가 시며 왼쪽 여백을 한 번 클릭하여 확장 할 수 있습니다.
Alternatively you can disable it in code as described on Stack Overflow.
또는 스택 오버플로에서 설명한대로 코드에서 비활성화 할 수 있습니다.
From here you can clearly see I had a stable, but slow model. I made some advancements from that point, but I'll wait with sharing them till the London Loop virtual race is over.
여기서 안정적이지만 느린 모델을 분명히 볼 수 있습니다. 나는 그 시점부터 몇 가지 발전을 이루었지만, 런던 루프 가상 경주가 끝날 때까지 나눠서 기다릴 것입니다.
Track data
프로젝트에 몇 가지 샘플 트랙이 포함되어 있습니다. London Loop은 그들 중 하나가 아니기 때문에 가상의 인종에 참여하고 있기 때문에 스스로 준비했습니다. 내가 제기 한 GitHub 끌어 오기 요청에서 가져올 수 있습니다. 다행스럽게도 곧 병합 될 예정이지만, 지금은 워크샵 저장소에 가입하여 거기에서 London_Loop_track.npy 파일을 다운로드 할 수 있습니다.
Bulk logs download
The cw_utils.py is missing a method to download all of the logs in a given group. It would be handy, so I wrote my own: https://github.com/aws-samples/aws-deepracer-workshops/pull/20.
Parameters:
- pathprefix is beginning of a relative file path,
- log_group is the log group in CloudWatch that you want to download the logs from. The log groups you will be interested in are:
- /aws/robomaker/SimulationJobs - logs from training simulations and evaluations,
- /aws/deepracer/leaderboard/SimulationJobs - logs from evaluations submitted to a virtual race,
- not_older_than - date string to provide the lower time limit for the log event streams; if there is at least one log event newer than that, the stream will be downloaded; For today logs (19th of May) I set it to 2019-05-19; refer to dateutil documentation to learn about accepted formats,
- older_than - upper limit date, pretty similar as not_older_than but the other way round; If you set it to 2019-05-19, the newest entries in accepted stream will be from 2019-05-18 23:59:59.999 at the latest.
Return value is a list of tuples containing:
- log file path
- simulation id
- first log event timestamp
- last log event timestamp
Entries are ordered by occurence of the last timestamp event.
If you are using a non-root account to access DeepRacer, you may be needed permissions to run method describe_log_streams.
If you call the method with pathprefix value ooh/eeh/ooh/ah/aah/ting/tang/walla/walla/bing/bang/deepracer-eval- and log_group is /aws/deepracer/leaderboard/SimulationJobs, and there is a log_stream for simulation sim-l337h45h, the file created will be ooh/eeh/ooh/ah/aah/ting/tang/walla/walla/bing/bang/deepracer-eval-sim-l337h45h.log
That's all folks
I'm not pretending I know much about the notebooks. Two weeks ago I didn't understand what they were or how to use them. This one has proven to be extremely useful when analysing my model's performance, and not only mine.
Well done, you've made it this far! Once again, let me mention my modification of the tool: "Analyzing the AWS DeepRacer logs my way" - I have raised a Pull Request to AWS with this change but you can already enjoy it now from my fork.
나는 노트북에 대해 많이 알고있는 척하지 않습니다. 2 주 전 나는 그들이 무엇인지, 어떻게 사용하는지 이해하지 못했습니다. 이 모델은 내 모델의 성능을 분석 할 때 매우 유용하다는 것이 입증되었습니다.
잘 했어, 너 지금까지 해냈어! "AWS DeepRacer 로그 분석하기"-이 변경으로 AWS로 끌어 오기 요청을 제기했지만 현재 내 포크에서 이미이 기능을 사용할 수 있습니다.
Great thanks to Lyndon Leggate for spotting that I misused the logs api initially. Lyndon is currently in top 10 in London Loop as well, he started the discussion group on Slack that I mentioned in my earlier posts. You are most welcome to join it: click here.
처음에 로그 API를 오용 한 점을 발견 한 Lyndon Leggate에게 감사드립니다. 린든은 현재 런던 루프 (London Loop)에서도 톱 10에 속해 있으며, 이전 글에서 언급 한 슬랙 (Slack)에 대한 토론 그룹을 시작했습니다. 가입하시는 것이 가장 좋습니다 : 여기를 클릭하십시오.
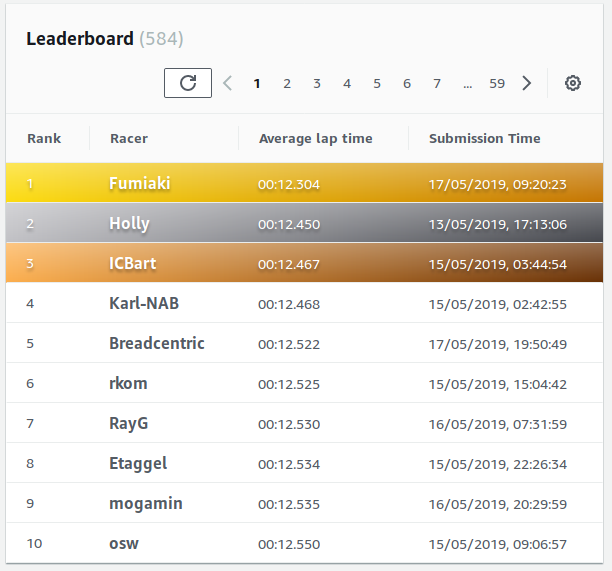
I will be soon writing about the First AWS DeepRacer League Virtual Race called London Loop which I'm taking part in. It's different from the London Loop and much bigger in scale - almost 600 participants so far (and more to come, I'm sure), still two weeks left to compete, top lap of 12.304 seconds and fifty best entries are within a second of that. And I'm fifth at the moment :)
런던 루프와 다른 점은 규모가 훨씬 더 큰 것입니다. 거의 600 명의 참가자가 참여하고 있습니다. 물론), 경쟁하기 위해 2 주 남겨 뒀다, 12.304 초의 최고의 랩과 50 최고의 항목은 그것의 두 번째 이내에있다. 그리고 나는 지금 5 번째입니다 :)
Race on!
'IoT > AWS DeepRacer' 카테고리의 다른 글
| AWS DeepRacer Virtual 대회에서 9초대를 기록하기 까지의 과정 공유 (0) | 2019.10.01 |
|---|---|
| Robolink Zumi 도착 (0) | 2019.08.28 |
| AWS Deepracer 이렇게만 하면 상위권 간다. (0) | 2019.08.06 |
| AWS Deepracer Virtual Circuit The Empire City 2019/7 (0) | 2019.08.04 |
| AWS DeepRacer League - New York을 다녀와서 (0) | 2019.07.24 |
| AWS Deepracer Forum Q&A (1) | 2019.07.08 |
| AWS Deepracer Virtual Race 최초 참가 경험 정리 (0) | 2019.07.07 |
| MEGAZONE CLOUD AWS DeepRacer League in Korea (0) | 2019.06.25 |
| 테슬라 주가와 2011년 넷플릭스 주가 비교 (0) | 2019.06.05 |
| AWS DeepRacer League and 2nd Virtual Race open (1) | 2019.06.04 |